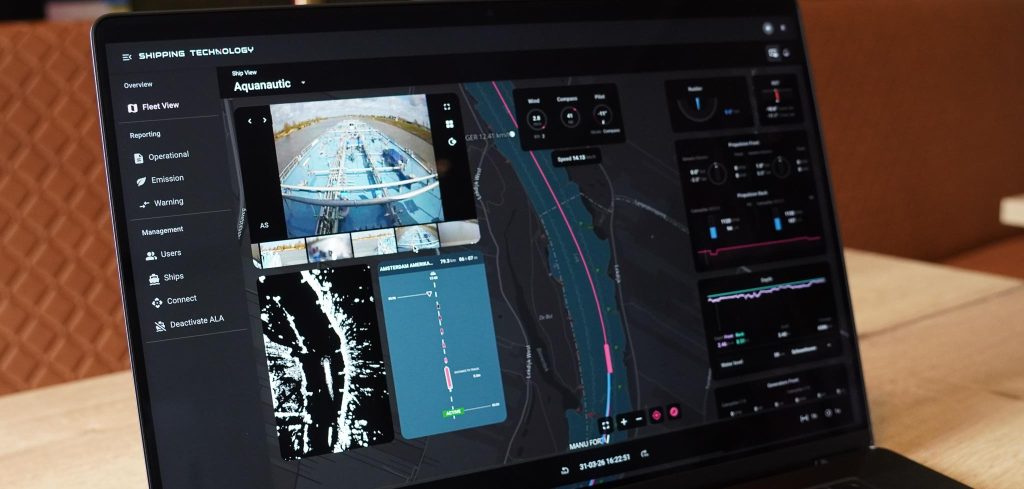
We have renewed the Ship View within the ST Dashboard. This gives users one clear place for live and historical vessel data. The result is a complete and user friendly dashboard for inland shipping.
The new Ship View works with widgets. These include speed, course, Rate of Turn (ROT), draught, fuel consumption and several other options. Depending on the onboard installation, camera footage, radar, ST SAILING and Energy Storage Systems can also be displayed.
An important new feature within the Ship View is the timeline. This allows you to easily go back to a specific moment in time. Select a date and time and see which data was available at that moment. This makes retrospective analysis much easier, for example when reviewing a manoeuvre, deviation or operational question.
The map view has also been renewed. The map is central to the Ship View and moves along with the selected timeline. This means you can see not only where the vessel was, but also what was happening around the vessel at that moment.
For vessels with cameras on board, both live and historical footage is available. This can be viewed in full screen or with several views side by side. Radar and ST SAILING are also visually integrated.
With the new Ship View, we make vessel data more accessible and more useful for day to day operations. At the same time, we are continuing to develop dashboards for specific target groups within inland shipping, such as tanker shipping and passenger shipping. This ensures that the insights align even better with daily practice on board and on shore.
Curious how the ST Dashboard with the new Ship View could benefit your fleet? Please contact us.